

In this tutorial we explain how show the error bar in Matplotlib graphs (matplotlib errorbar). Python. The error bar, is a bar that indicates the error of some measurement. It is widely used in statistics, mainly in scatter diagrams.
Adding the error bar in Matplotlib, Python.
It´s very simple, we just have to write the value of the error.
We use the command:
plt.errorbar(x, y, yerr = 2, capsize = 3)
Where:
- x, are the data of the X axis.
- y, are the data of the Y axis.
- yerr, is the error value of the Y axis. Each point has its own error value.
- xerr, is the error value of the X axis.
- capsize, is the size of the lower and upper lines of the error bar.
A simple example, where we only plot one point. The error is the 10 % on the Y axis.
import matplotlib.pyplot as plt
x = 1
y = 20
y_error = 20*0.10             ## El 10% de error

plt.errorbar(x,y, yerr = y_error, capsize = 3)
plt.show()

Here is an asymmetric example.
We will explain it later.

Matplotlib errorbar example.
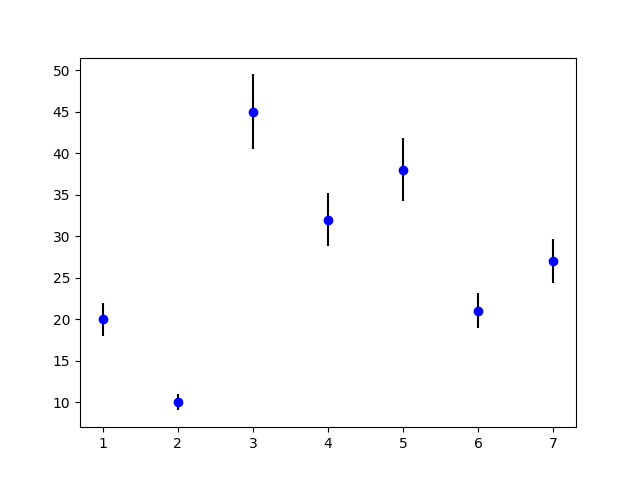
Now a slightly more complex example. Here we will use the numpy library to generate the arrays that will be ploted.
First we generate the data in X and Y.
Next, we generate the error of each point.
Then we plot using the command “plt.errorbar (…)”, giving it the desired characteristics.
The code is the following:
import matplotlib.pyplot as plt
import numpy as np

x = np.arange(1,8)
y = np.array([20,10,45,32,38,21,27])
y_error = y * 0.10    ##El 10%

plt.errorbar(x, y,  yerr = y_error, linestyle="None”,  fmt="ob",  capsize=3,  ecolor="k")
plt.show()
Parameters of the errorbar:
- yerr, is the error value in each point.
- linestyle, here we indicate that we will not plot a line.
- fmt, it is the type of marker, in this case is a point (“o”) blue (“b”).
- capsize, is the size of the lower and upper lines of the error bar.
- ecolor, is the color of the error bar. The default color is the marker color.
Note: We can combine “plt.plot” and “plt.errorbar” if we think necessary.

Matplotlib errorbar no line.
If we want not plot a line using “plt.errorbar (…)“, we use the parameter linestyle = “None”.
plt.errorbar(x, y, yerr = y_error, linestyle="None”, fmt="ob", capsize=3, ecolor="k")
Matplotlib errorbar Caps.
We can edit the errorbar, adding lower and upper lines or changing the thickness.
plt.errorbar(x, y, yerr = y_error, linestyle="None”, fmt="ob", capsize=3, ecolor="k")
Command capsize, Matplotlib.
This command indicates the length of the cap lines of the error bar. If we do not use it, by default the length will be 0 and we will not see lines at the end.
Command capthick, Matplotlib.
This command indicates the width of the cap lines of the error bars.

Matplolib errorbar color.
We can edit the color of the errorbar in Matplotlib, using the “ecolor” parameter.
plt.errorbar(x, y, yerr = y_error, linestyle="None”, fmt="ob", capsize=3, ecolor="k")
If we omit this parameter, the color of the error bar will be the same as the marker.
We have several colors to choose:
k, black
b, blue
g, green
r, red
y, yellow
You can see more colors here:
Matplolib errorbar asymetric.
An asymmetric error bar does not have the same error on each side. This can be done very easily in Python using matplotlib.
We only need to modify the error and do it with 2 values, something like this:
import matplotlib.pyplot as plt
import numpy as np

x = np.arange(1,8)
y = np.array([20,10,45,32,38,21,27])

y_error = [y * 0.05, y*0.1]  ##El 5% en un lado y el 10% en el otro

plt.errorbar(x,y, linestyle="None", yerr = y_error, fmt="ob", capsize=7, ecolor="k")
plt.show()

Matplotlib errorbar style, Python.
We have already seen several parameters, this is a summary:
- Fmt, it is the type of marker, in this case is a point (“o”) blue (“b”).
- Linestyle, here we indicate that we will not plot a line.
- Ecolor, is the color of the error bar. The default color is the marker color.
- Elinewidth, is the width of the error bar.
- Capsize, is the size of the lower and upper lines of the error bar.
- capthick, indicates the width of the cap lines of the error bars.
- Barsabove, is True of False.
Errorbar Python examples, Matplotlib.
Here are two examples for a graph with error bars in Python, using Matplotlib.
We include some parameters that were not explained before. The “plt.errorbar (…)” command uses almost all the parameters that are used in the “plt.plot (…)”command.
import matplotlib.pyplot as plt
import numpy as np
x = np.arange(1,8)
y = np.array([20,10,45,32,38,21,27])
y_error = y * 0.10  ##El 10%

plt.errorbar(x, y,  linestyle=":",  yerr = y_error,  fmt="sb",  markersize=9, capsize=3,  ecolor="k",  barsabove=True)
plt.show()

import matplotlib.pyplot as plt
import numpy as np
x = np.arange(1,8)
y = np.array([20,10,45,32,38,21,27])

y_error = y * 0.10  ##El 10%

plt.errorbar(x, y, linestyle="None", yerr = y_error, fmt="or", markersize=9, capsize=7, ecolor="b", elinewidth=3)
plt.show()
