

In this tutorial we explain how to use trigonometric functions in Python using the math library. The sine, cosine and tangent. We also explain how to work with degrees and radians (Pyhon math sin).
We will use the “math” library to work with trigonometric functions.
Python’s math library includes trigonometric functions and many more commands that are used in mathematics.

Importing the library.
To import the library we use the following code:
import math
Using sin and cos in Python.
In the math library the trigonometric functions are in radians and not degrees.
The command to obtain the sine, cosine and tangent of an Angle of 57.3 degrees, which in radians is approximately 1, is the following:
import math
a=math.sin(1)
b=math.cos(1)
c=math.tan(1)
print(a)	   ##Imprime: 0.841
print(b)	   ##Imprime: 0.54
print(c)	   ##Imprime: 1.557
As we can see, it is very easy to use the trigonometric functions with Python using the math library. Working with Degrees instead of radians, Python.
We can use degrees instead of radians. We can do the following:
- Enter the angle in degrees.
- Convert to radians.
- Use the trigonometric functions of the math library.
The code is the following:
import math

grados = 60
radianes = (grados* math.pi)/180

seno = math.sin(radianes)
coseno = math.cos(radianes)
tangente = math.tan(radianes)

print(seno)
print(coseno)
print(tangente)
Graphing sine, cosine, and tangent in Python.
Here is a graph with the 3 trigonometric functions.
As you can see, on the x-axis they are degrees
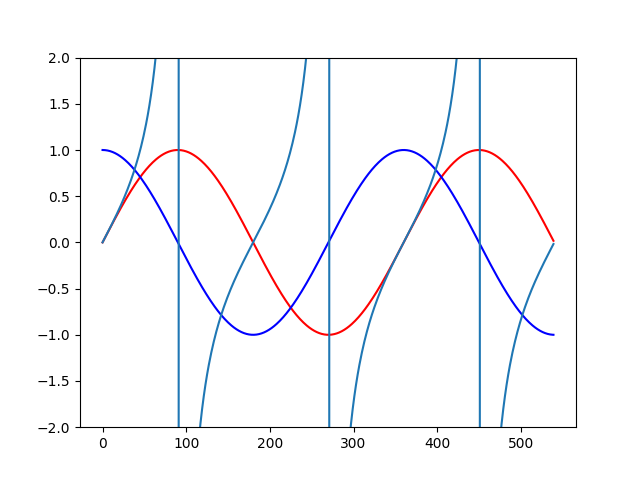
The red color is the sine, the blue color is the cosine and the other is the tangent.
This is the code of the previous graph:
import matplotlib.pyplot as plt
import math

grados = []
seno = []
coseno = []
tangent = []

for i in range(0,540):
	grados.append(i)
	radianes = (i* math.pi)/180
	seno.append(math.sin(radianes))
	coseno.append(math.cos(radianes))
	 tangente.append(math.tan(radianes))

plt.ylim(-2,2)
plt.plot(grados,seno,"r")
plt.plot(grados,coseno,"b")
plt.plot(grados,tangente)
plt.show()
You can see how we use from 0 to 540 degrees, we convert those to radians and get the result of the trigonometric functions. For later to be able to graph it.
We use the Matplotlib library to make the graph.
In the previous graph we restrict the Y axis from -2 to 2, this because the tangent tends to infinity. If we graph without the limit at Y axis we will only see the peaks, due the tangent tends to infinity.
For more python tutorials, go to the python section.